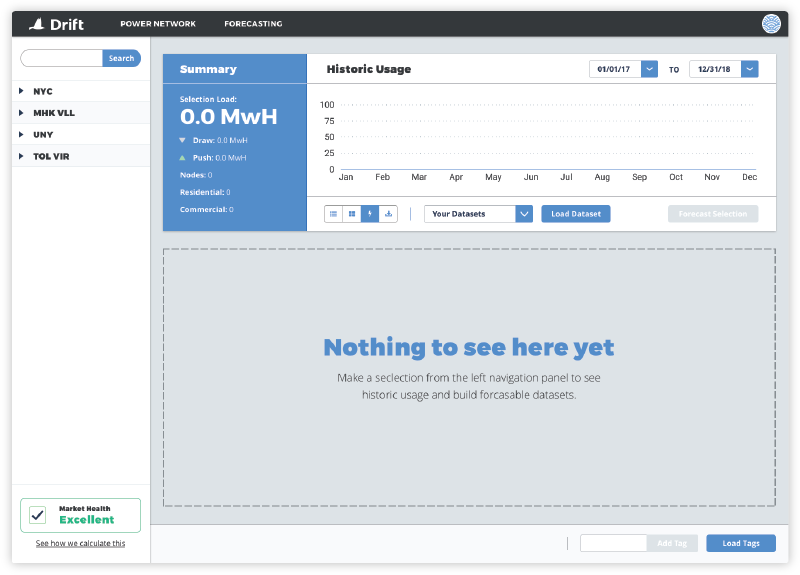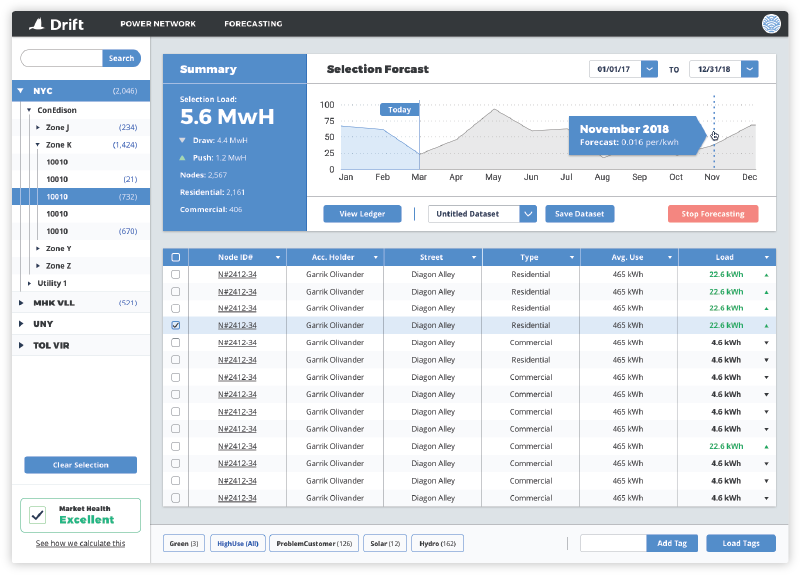
This project was an exploration of what a Drift interface might look like for a person who didn't just need to manage one or two properties, but a vast network of nodes that consume and produced electricity.
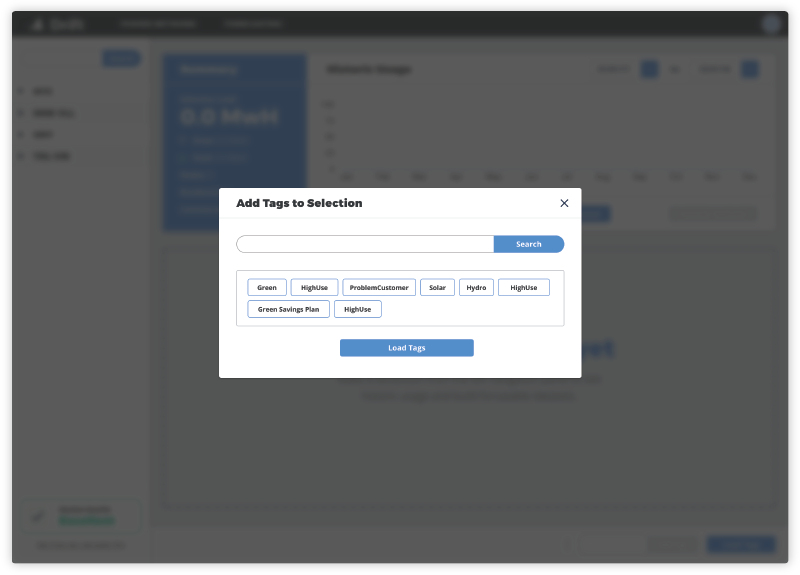
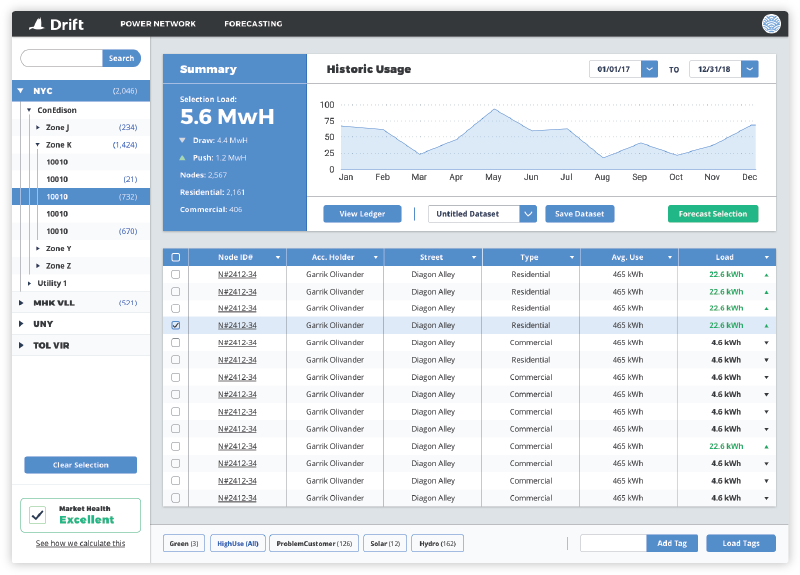
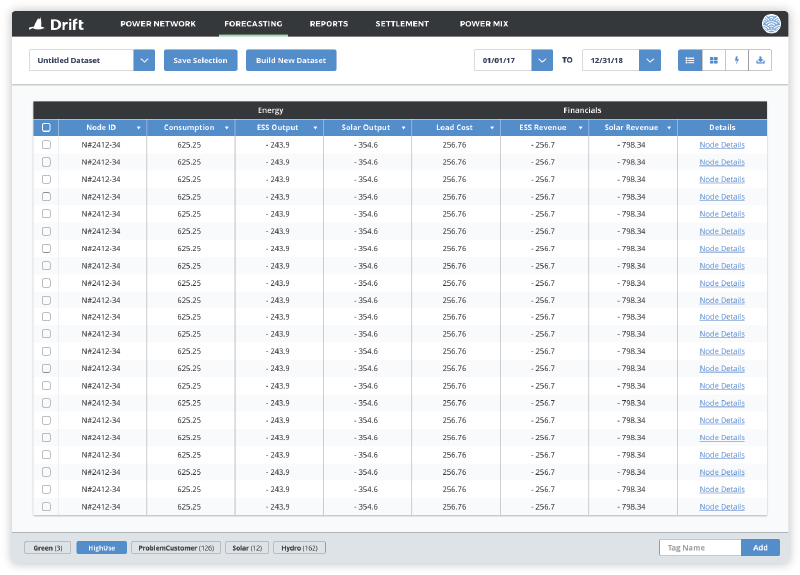
Our challenge was to allow a user to upload their raw data and then quickly sort, tag and create a library of datasets. They could then view this data through the lens of either historical usage, or Drift's forecasted energy supply prices, using both to make decisions about how they would purchase power for their network.